News Release from windfair.net
Wind Industry Profile of
Report Excerpt - .REN21 global renewable energy report
There was 1,712GW of renewable power capacity at the end of 2014, up 8.5 per cent on the previous year.
Renewables comprised about 28 per cent of the world generating capacity by the end of last year, enough to supply 23 per cent of global electricity demand.
China, the US, Brazil and Germany were the top four countries for renewable energy power, ahead of Spain and Italy in joint fifth and Japan and India behind them.
Denmark remains top of renewable power capacity per capita among the top 20 countries, with Germany, Sweden, Spain and Portugal completing the top five.
Solar energy
A record 40GW of solar power capacity was installed in 2014, raising total global capacity to 177GW.
China, Japan and the US accounted for the vast majority of new capacity, although Germany still leads the way with about 38GW of installed solar PV.
Latin America is the fastest growing regional market, although significant new capacity also came online in several African countries, while markets are picking up in the Middle East.
The UK saw 2.4GW of solar PV added in 2014
Concentrated Solar Power (CSP) capacity increased 27 per cent to 4.4GW. Although only the US and India added CSP plants in 2014, Spain remains the global leader with 2.3GW of capacity.
Solar thermal heating reached an estimated 406GWh by the end of 2014, providing about 341TWh of heat annually. China accounted for about 80 per cent of the world market for solar water collectors, followed by Turkey, Brazil, India and Germany.
Wind energy
Wind power also broke records, adding 51GW of capacity – a 44 per cent rise on last year when more solar capacity was installed than wind for the first time – to take the global total to 370GW.
An estimated 1.7GW of grid-connected capacity was added offshore – all in the UK, Germany, Belgium and China – for a world total exceeding 8.5GW.
Asia remained the largest market for the seventh consecutive year, with China accounting for 45 per cent of total additions. The continent overtook Europe in total capacity despite European installations reaching their second highest total ever.
Wind generated more than 20 per cent of electricity in several countries last year, including Denmark, Nicaragua, Portugal and Spain.

Other renewables
An estimated 37GW of new hydropower capacity was commissioned in 2014, raising the global total to about 1,055GW.
About 640MW of new geothermal power generating capacity came online, with Kenya representing the largest market. Total capacity growth has averaged 3.6 per cent for the last five years, bringing the global total to almost 12.8GW.
Global bio-power production increased about nine per cent, with China, Brazil and Japan leading for capacity additions, and the US and Germany leading for generation, despite comparatively smaller capacity additions.
Ocean energy capacity, mostly tidal power generation, remained at about 530MW in 2014, with almost all new installations being pilot or demonstration projects.
Policy
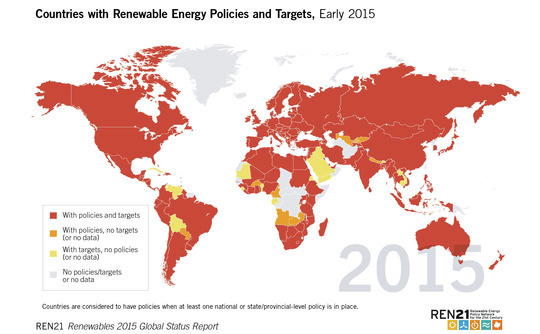
As of early 2015, 164 countries had renewable energy targets and an estimated 145 countries had renewable energy support policies in place.
Feed-in policies have been enacted in 108 jurisdictions at the national or state/provincial level, with Egypt being the latest country to add a national FIT.
An estimated 45 countries had targets for renewable heating or cooling in place by early 2015, primarily in the form of financial incentives.
Biofuel blend mandates were in place in 33 countries, with 31 national mandates and 26 state/provincial mandates.

Investment
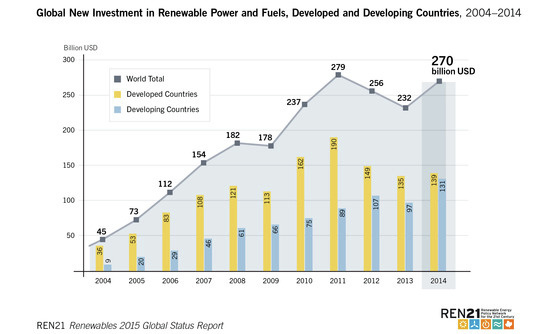
Global new investment in renewable power and fuels grew 17 per cent on 2013 to $270.2bn. This figure swells to $301bn if large hydropower projects are included.
All regions of the world experienced an increase in investment relative to 2013.
Solar power – mostly solar PV – accounted for more than 55 per cent of new investment in renewable power and fuels with $250bn, a 25 per cent rise, and wind power about 37 per cent at $100bn, up 11 per cent.
Geothermal power investment grew by 23 per cent and ocean energy 100 per cent, although from a very low level, while biofuels declined eight per cent to a 10-year low, biomass and waste-to-energy dropped 10 per cent, and small-scale hydropower slipped 17 per cent.
China, the US, Japan, the UK and Germany headed the world in investment in renewable power and fuels.
But Burundi heads the list of investments relative to per capita GDP, followed by Kenya, Honduras, Jordan and Uruguay.
Investment in developing countries was up 36 per cent to $131.3bn, nearly surpassing for the first time the total recorded in developed nations, which rose just three per cent to $138.9bn.
Please see http://www.ren21.net/wp-content/uploads/2015/06/REN12-GSR2015_Onlinebook_low1.pdf for more.
To receive more information on this article, our Newsletter or find out more about what w3.windfair.net has to offer, please, do not hesitate to contact Trevor Sievert at ts@windfair.net.
Please don't forget to follow us on Twitter: w3.windfair.net on Twitter
w3.windfair.net is the largest international B2B internet platform in wind energy – ultimately designed for connecting wind energy enthusiasts and companies across the globe.
- Source:
- REN1
- Author:
- Trevor Sievert, Online Editorial Journalist / By REN1 Staff
- Email:
- ts@windfair.net
- Link:
- www.windfair.net/...
